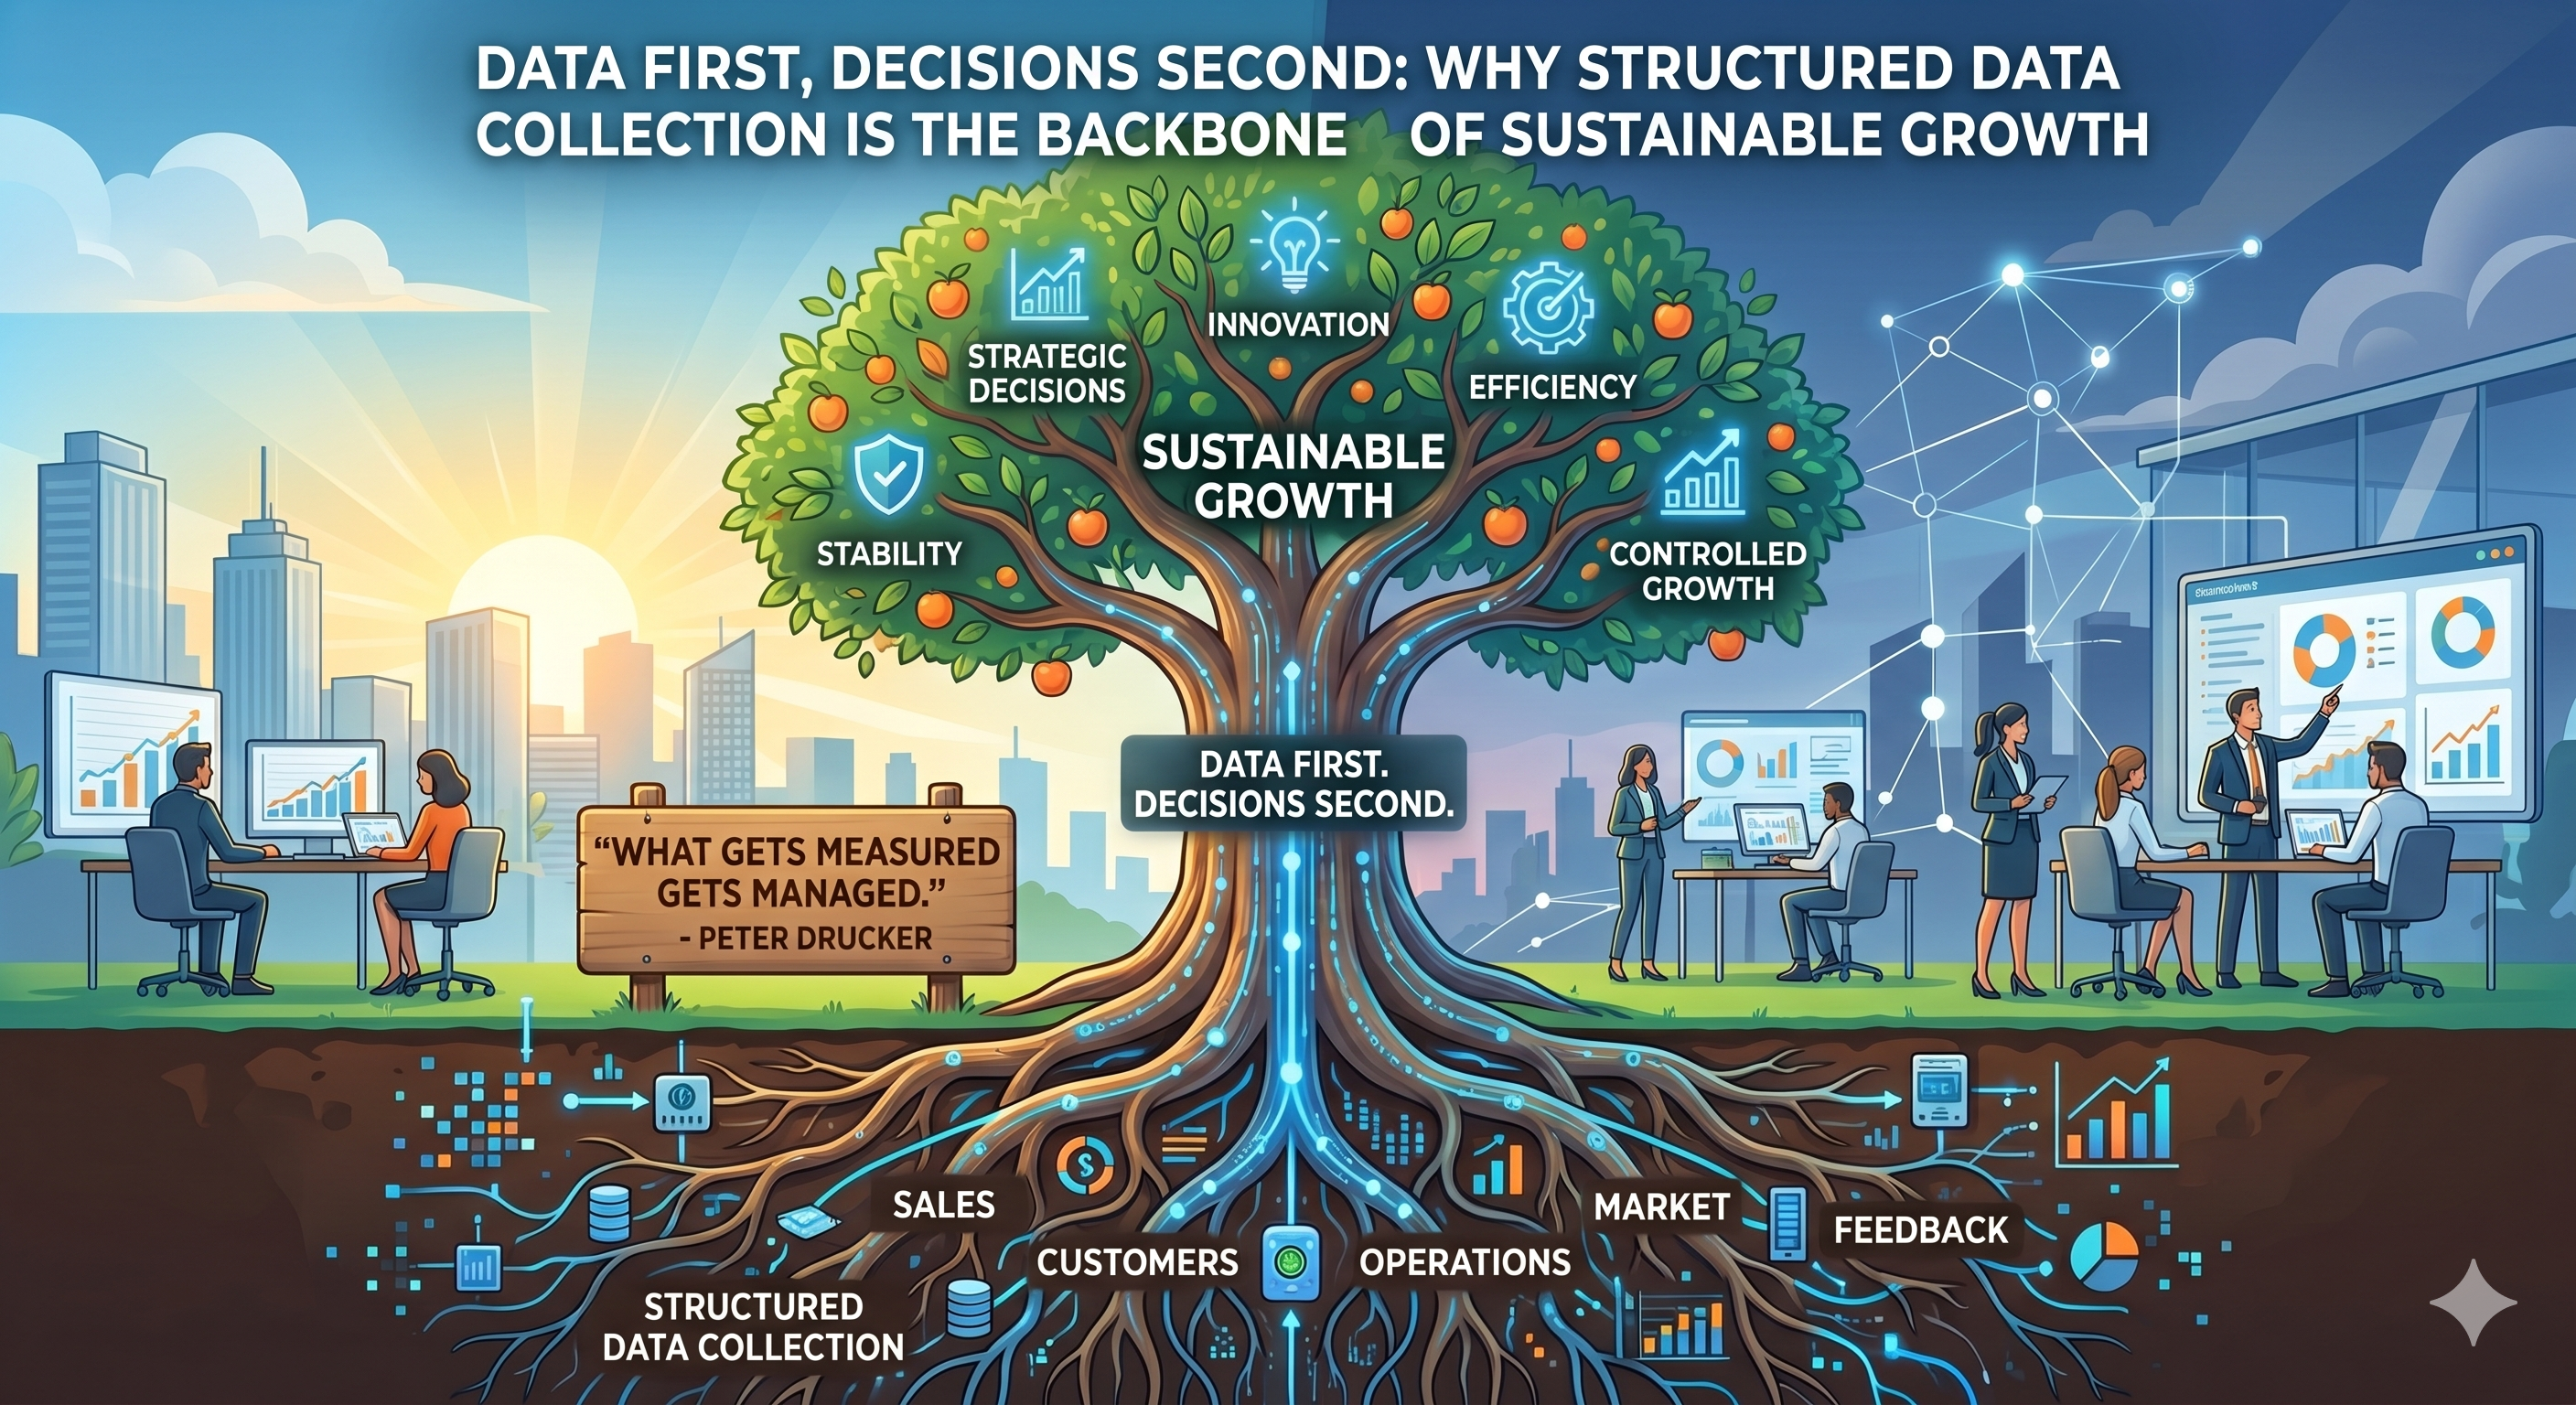
Data First, Decisions Second: Why Structured Data Collection Is the Backbone of Sustainable Growth
In any organization—whether a medical clinic, a service provider, or a community initiative—decisions shape outcomes. The quality of those decisions depends directly on the quality of the data behind them.
Data collection is not a technical activity reserved for analysts. It is a core operational discipline that brings clarity, reduces uncertainty, and enables controlled, sustainable growth.
This article outlines why data collection matters, how to validate sources, what tools can support the process, and how even simple data points can generate meaningful insights.
1. Why Data Collection Matters
1.1 Decision Accuracy
Data replaces assumptions with measurable facts. In its absence, decisions rely on intuition—valuable, but inconsistent and difficult to scale.
Impact:
- Reduces the risk of incorrect strategic direction
- Enables evidence-based prioritization
- Supports consistency in decision-making across teams
1.2 Performance Measurement
You cannot improve what you do not measure. Data provides visibility into performance and highlights operational gaps.
Examples of measurable areas:
- Patient flow in clinics
- Conversion rates (visits → treatments)
- Customer engagement levels
1.3 Continuous Improvement
Structured data enables iterative optimization and disciplined execution.
Operational cycle:
Input → Process → Output → Measurement → Adjustment
Without measurement, this cycle breaks. Improvement becomes reactive rather than controlled.
2. Data Sources: Reliability and Validation
Collecting data is only the first step. Its value depends on how reliable, consistent, and relevant the source is.
2.1 Types of Data Sources
Primary Sources (high level of control):
- Internal systems (CRM, ERP, medical software)
- Direct interactions (forms, surveys, QR scans)
- Operational logs
Secondary Sources (external context):
- Market research reports
- Industry benchmarks
- Public datasets
2.2 Validation Criteria
Before using any dataset, it must be assessed against clear criteria:
- Accuracy – Is the data correct and error-free?
- Completeness – Are there missing values?
- Consistency – Is data collected uniformly over time?
- Relevance – Does it directly support the decision needed?
Risk: Decisions based on flawed data can be more damaging than decisions made without data.
3. Tools for Data Collection
Effective data collection does not require complex systems from the beginning. The key is alignment between the tool and the objective.
3.1 Entry-Level Tools (Accessible and Efficient)
- QR code generators with analytics (scan volume, location, timing)
- Google Forms / Microsoft Forms (structured data input)
- Spreadsheets (Excel, Google Sheets) for centralized tracking
3.2 Intermediate Tools (Operational Integration)
- CRM systems for tracking customer behavior
- Website analytics tools (e.g., Google Analytics)
- Appointment systems for managing patient flow
3.3 Advanced Tools (Scalability and Automation)
- BI platforms (Power BI, Tableau) for dashboards and visualization
- Data warehouses for structured storage
- Automation tools (Zapier, Make) for real-time data flows
4. Practical Example: From Simple Data to Strategic Insight
Data is most valuable when it leads to actionable conclusions.
In my case, I approach every role—both professionally and personally—with a data analyst mindset.
During a recent event at the Hanami Festival, where we performed a demonstration of Jōdō (a traditional Japanese martial art), our objective was clear: increase visibility and awareness.
Setup
- Demonstration performed live
- Roll-up banner displayed
- QR code linked to the association’s website
Data Collection Method
Using a QR code tracking application, we collected:
- Number of scans
- Time of interaction
- Geographic distribution
Observations
- Expected: scans during the event
- Unexpected: continued scans after the event
- Insight: scans originated from multiple cities
Interpretation
Participants took photos during the event and later accessed the QR code from those images.
Output
| Metric | Insight |
|---|---|
| Post-event scans | Extended exposure beyond event duration |
| Geographic spread | National-level visibility |
| Engagement behavior | Delayed interaction still relevant |
Decision Impact
- Events generate value beyond physical presence
- Visual materials (QR codes) extend lifecycle of engagement
- Future strategy should include:
- Stronger visual call-to-action
- Post-event tracking as a standard KPI
Conclusion:
A simple tool, correctly used, can generate insights with strategic value.
5. Key Takeaways
- Data collection is not optional; it is a control mechanism for decision-making
- The value of data depends on the reliability of its source
- Tools should be selected based on purpose, not complexity
- Even simple data points can reveal high-impact insights when properly interpreted
Final Perspective
Data does not replace intuition—but it disciplines it.
Organizations that systematically collect and use data operate with clarity and control. Those that do not remain exposed to uncertainty.
The difference is not access to tools, but discipline:
collect → validate → analyze → act → improve
This is how decisions become structured, measurable, and repeatable.
When data collection is structured, validated, and aligned with clear objectives:
- Decisions become consistent
- Risks become visible
- Growth becomes controllable
The real advantage is not in having more data, but in using the right data at the right moment.
And sometimes, even a simple QR code can reveal more than expected—if you choose to measure it.
Related Posts
The Power of Data in Healthcare: Enhancing Medical, Operational, and Marketing Decisions
Power of Data in Healthcare, Personalized Patient Care, Operational Management, Improved Resource Management,Targeted Marketing Campaigns
How Toy Dispensers and Digital Walls are Revolutionizing Pediatric Care
children feel safe, happy, and eager to return, toy dispenser, digital wall
Optimizing Operational Management for Dental Clinics: Key Performance Indicators (KPIs) to Monitor
Key Performance Indicators (KPIs), Optimizing Operational Management
